Transform your BI & Analytics into a self service!
The emergence and adoption of DataViz tools (such as Tableau Software or Microsoft Power BI) in the organisations allowed more and more people to access datas and develop their reports.
Transforming your BI & Analytics into a self service creates a new stake : how prosumers can access relevant information about these datas and how we can apply a process to publish these reports.


Team
3 to 5 persons

Duration
1 to 3 months

Difficulty
Moderate
Request
I need to identify who uses the data in my organization and help prosumers to understand their data sources but also how their datas are transformed from one source to another.
Features
- Custom attributes
- Filtered view
- Data classification by business domains
- Up to column data Lineage
- Crowdsourcing
- Automatic classification
Simplify the creation of corporate reports !
————————
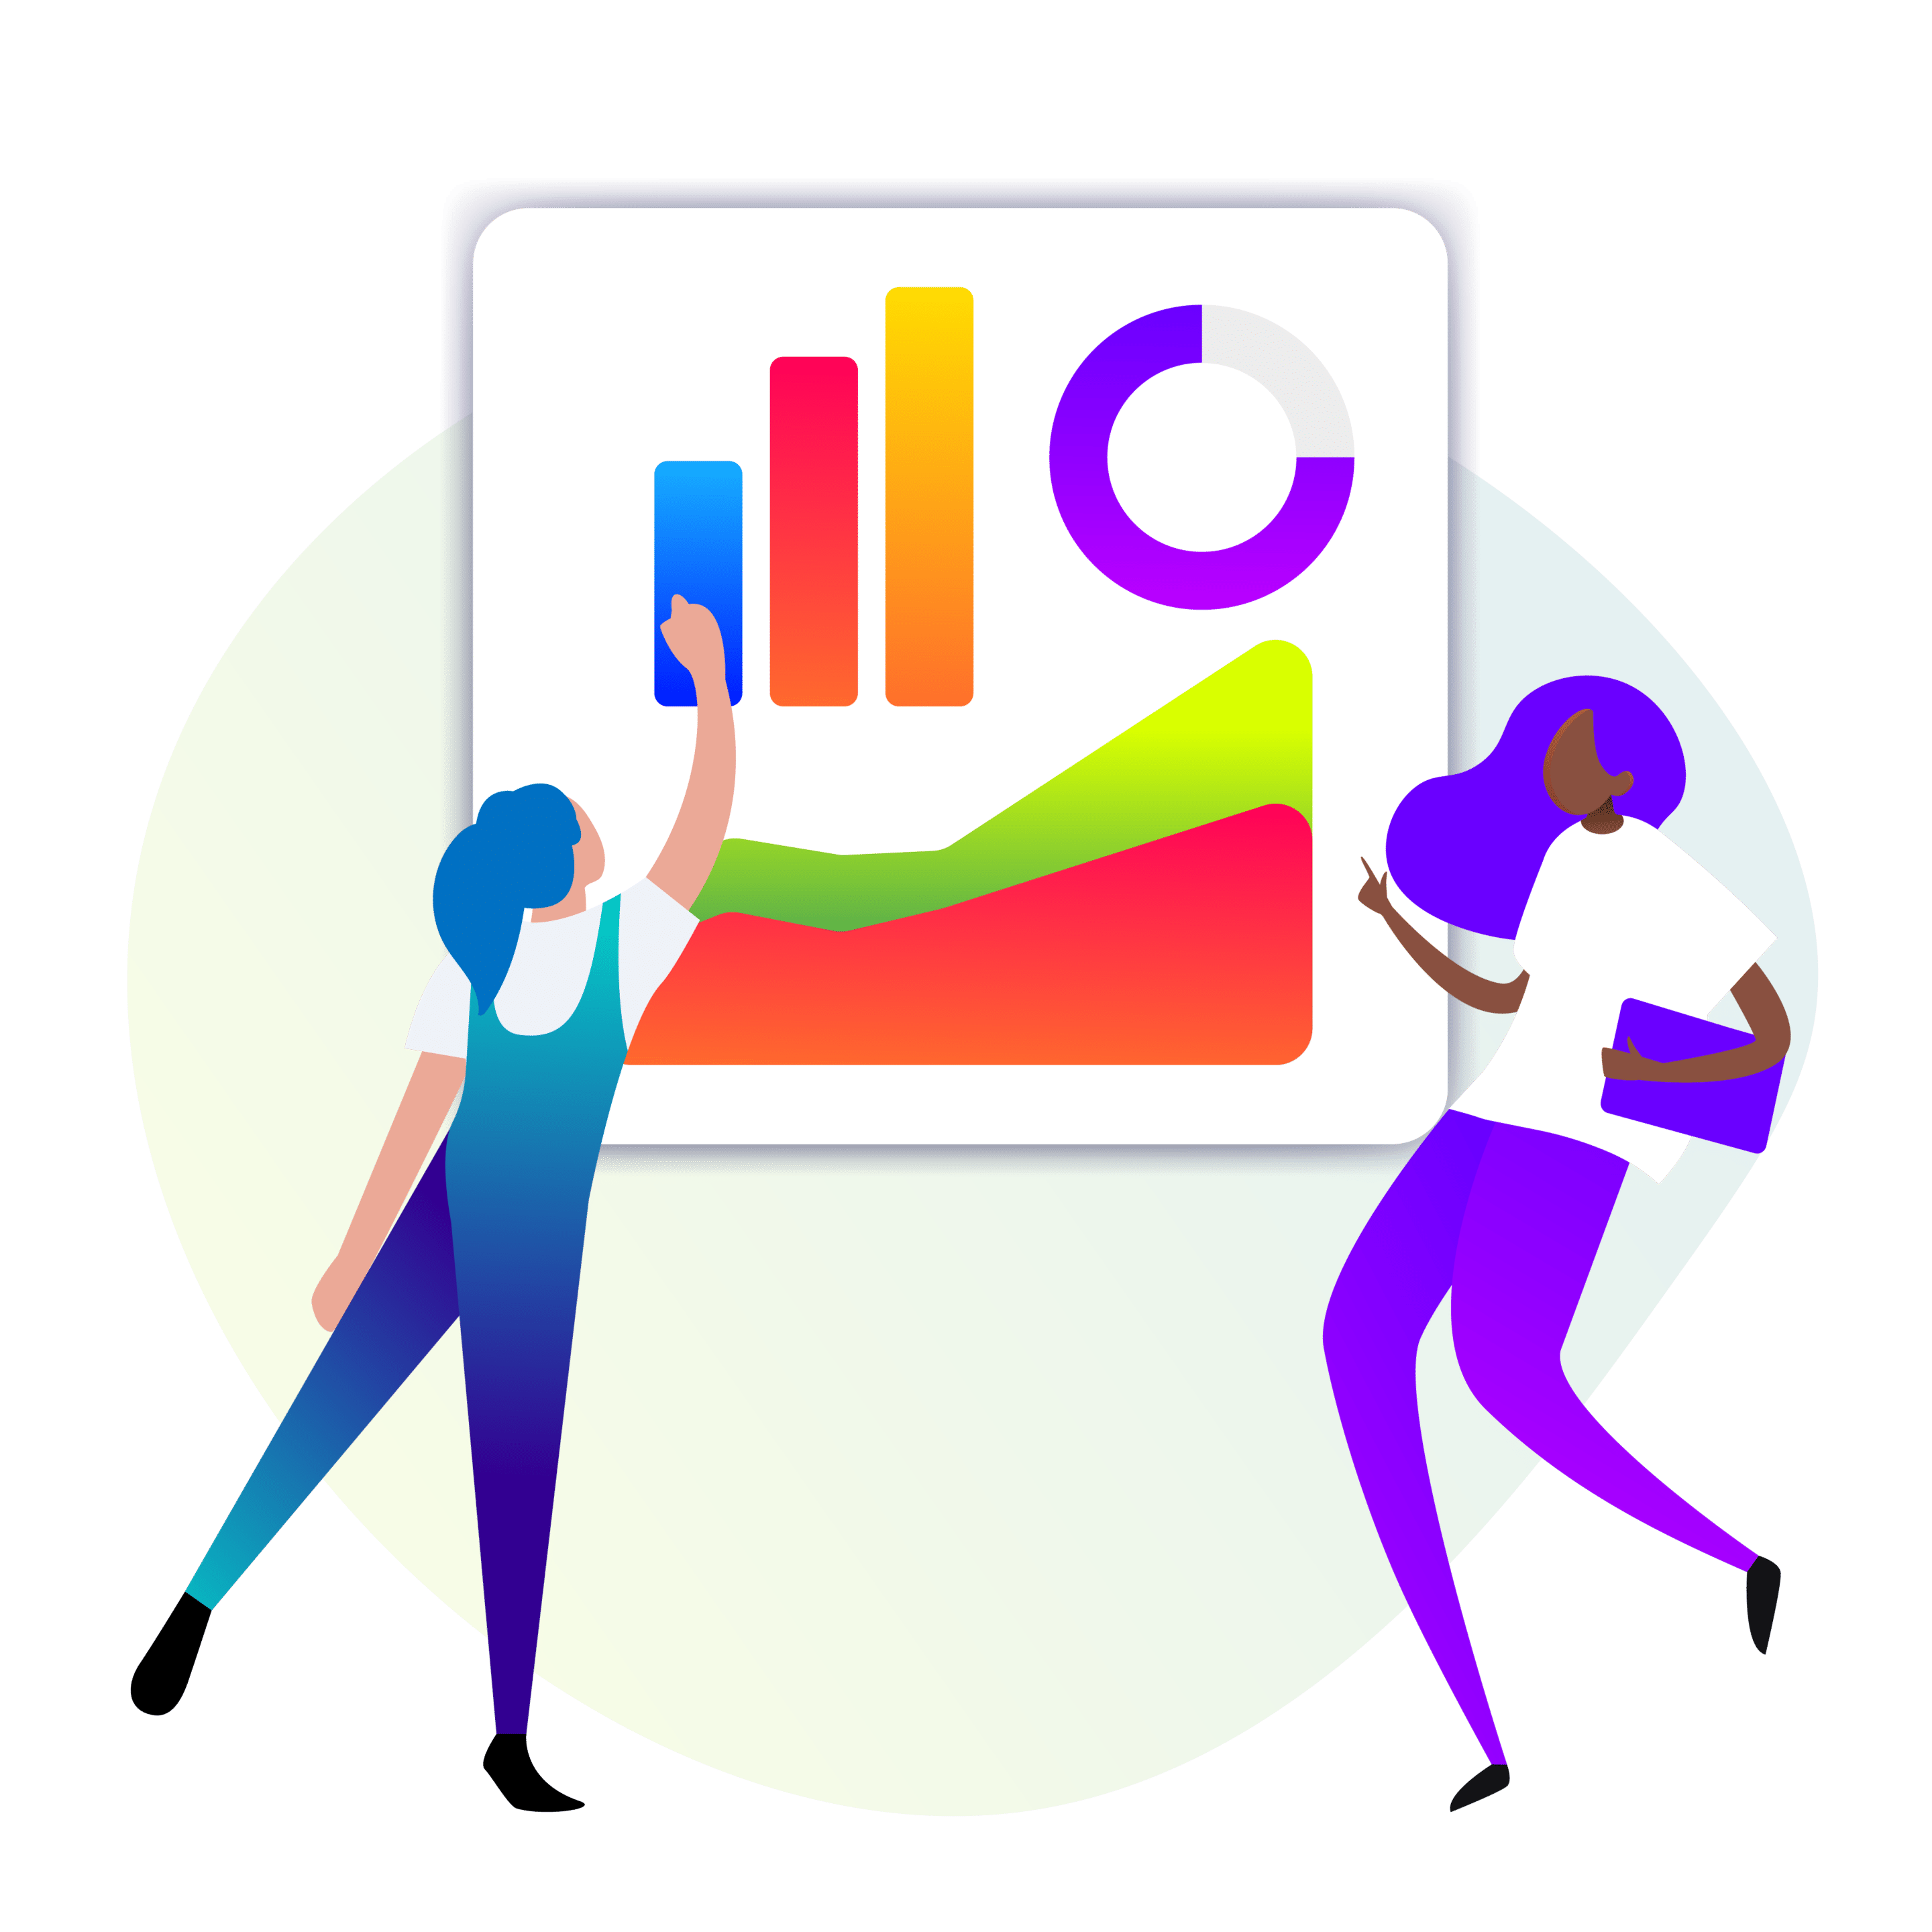
The biggest risks when talking about Self BI & Analytics is ungoverned data : KPI with different formulas, reports using obsolete data source, redundant reports…
The 360 DataCatalog is the best way to resolve this issue easily.
The business glossary can provide a unique & centralised view of all the available KPI and their formulas. It’s a business oriented component, allowing all business users to easily use it and enrich it!
You can also highlight the relations between indicators (which indicator is part of another, a duplicate…) and / or dimension (which dimension can we use with this indicator…)
This way, your users can use certified data to create coherent reports and reduce the risk of data misinterpretation or discrepancies in values between services or business units.
Manage report listing & publishing
————————
When creating a large number of reports, a question often is asked: how to ensure that only the right reports are published?
To answer this question, you might consider setting up a publication cycle similar to the one below :
- Detect new reports published on the data viz portal
- Realize a review by a peer / a key users
- Validate the report and promote it as a corporate report
- Inform end-users of the new report
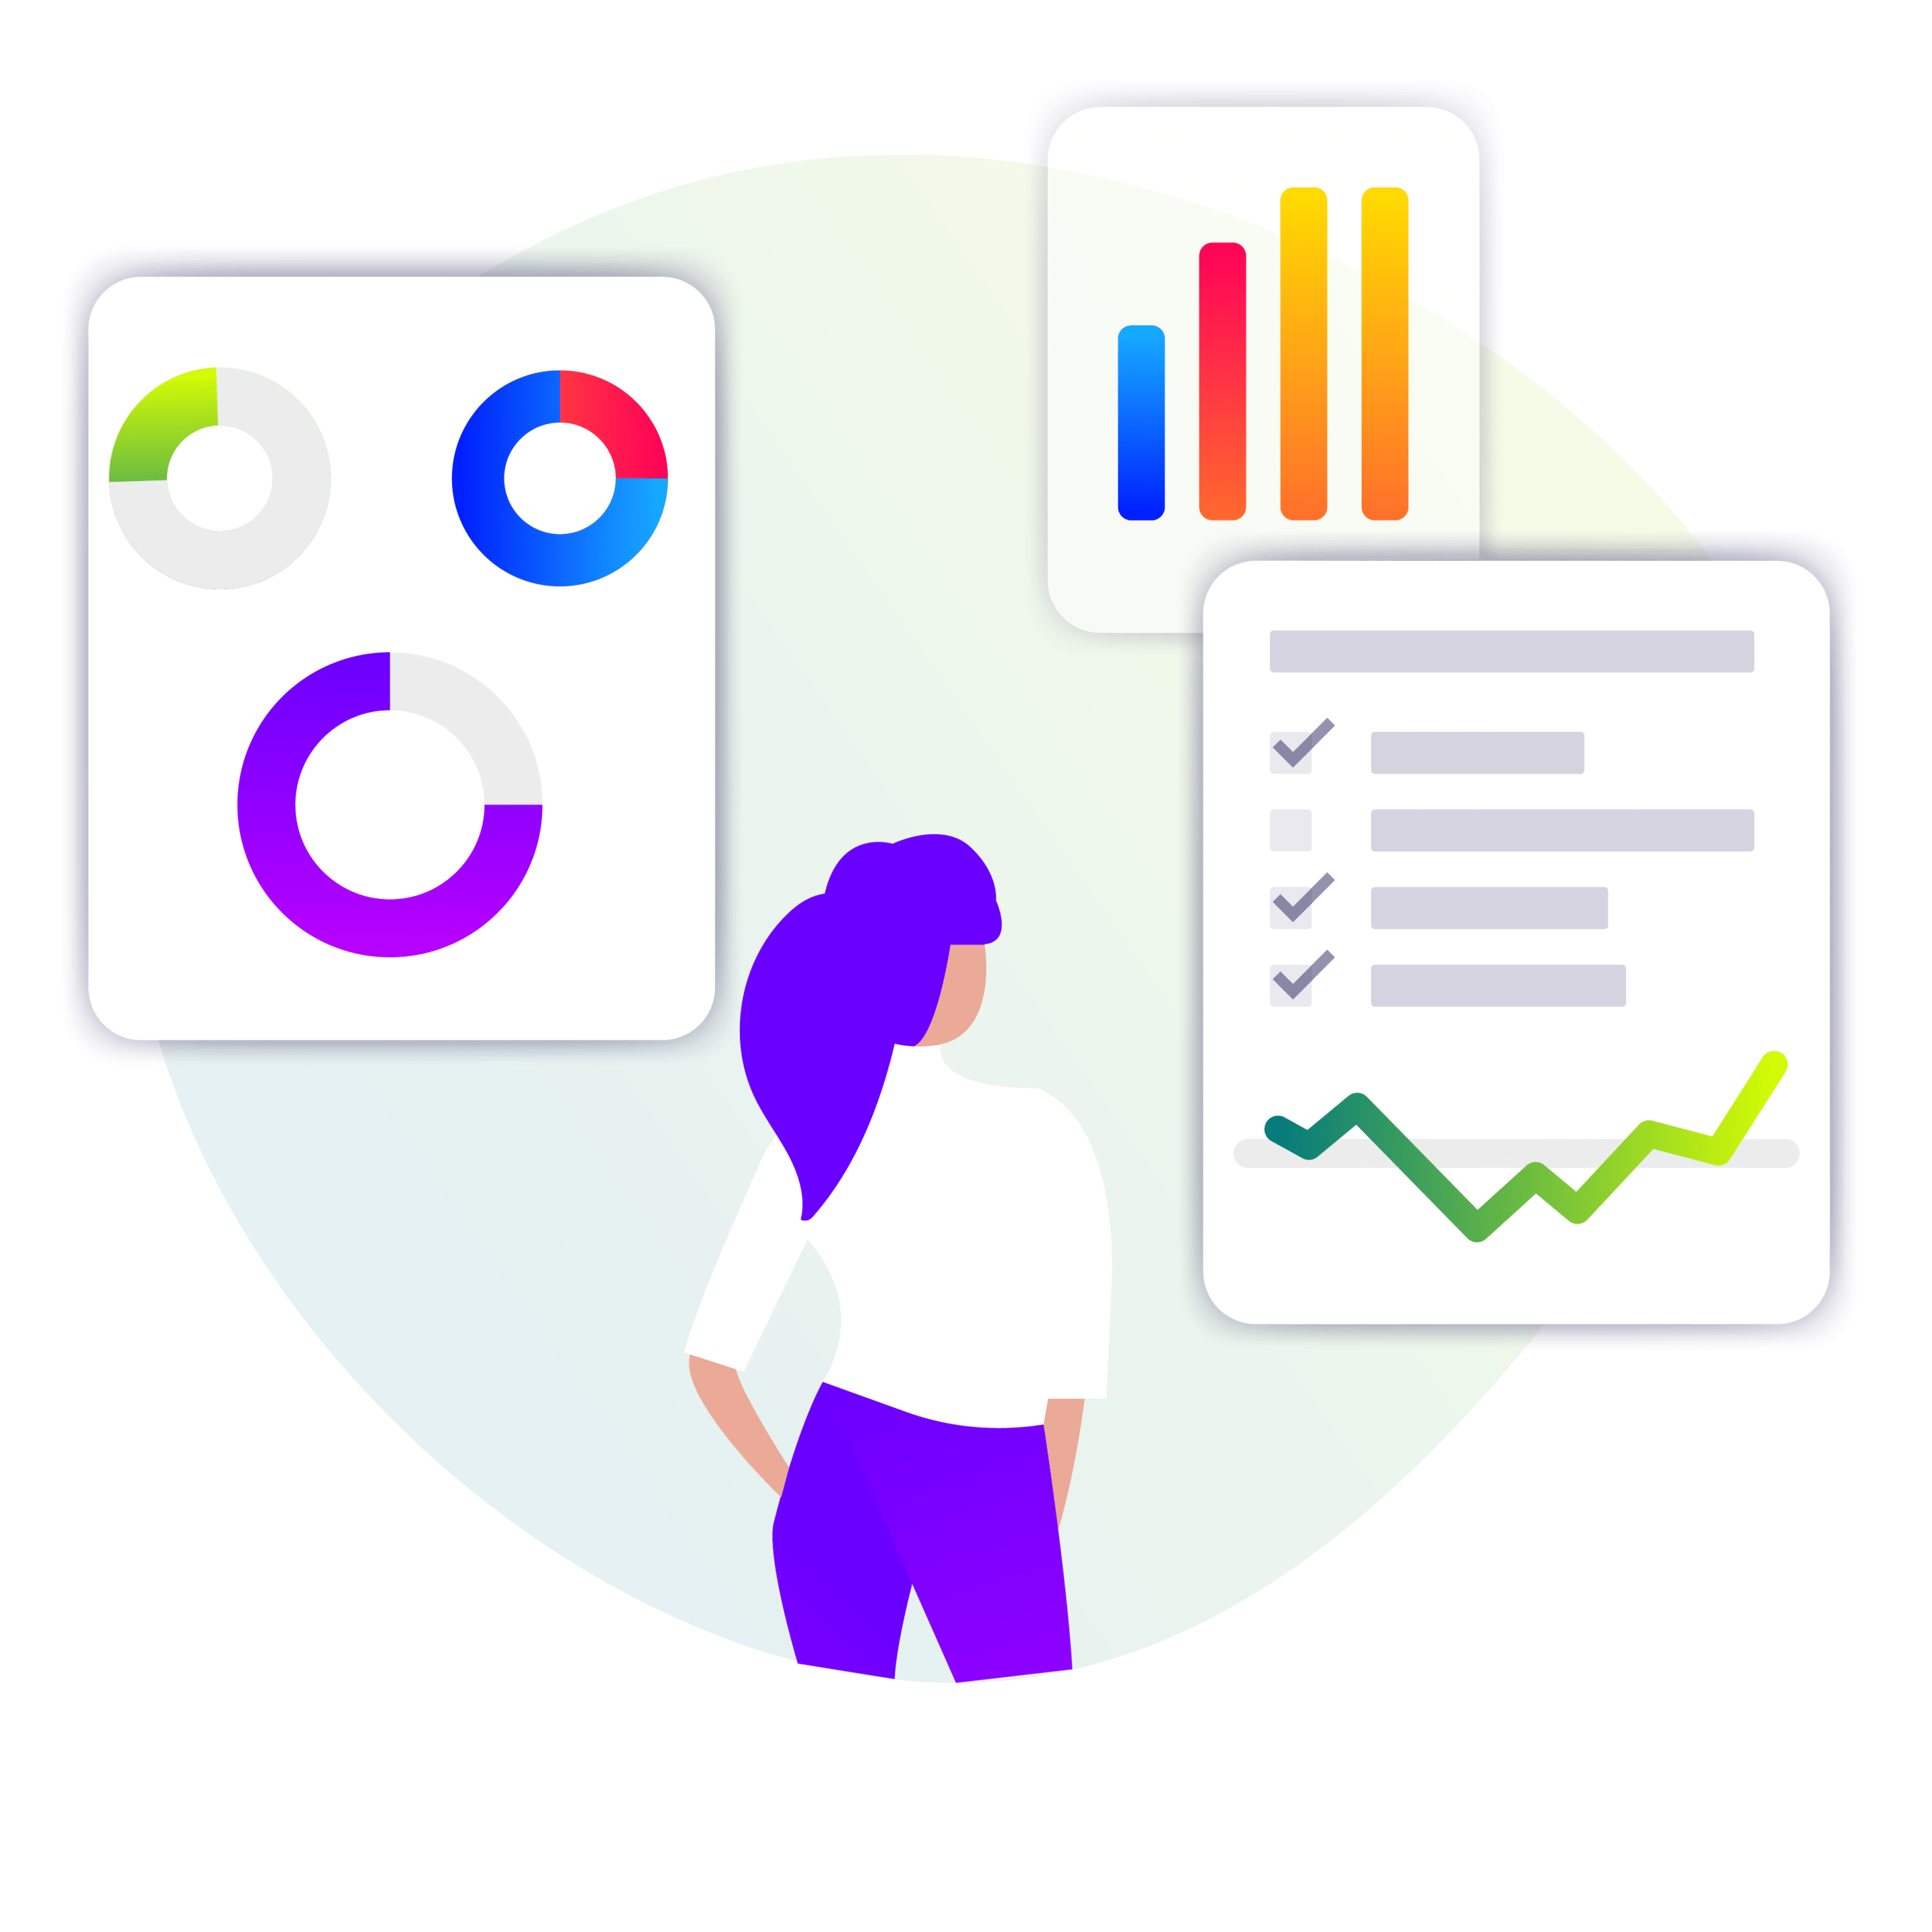
DataGalaxy can help you easily implement this publishing cycle. For example, with our DataGalaxy connector, you can import all your Microsoft Power BI or Tableau Software reports into DataGalaxy in a snap. You can then describe and document these reports so that any user can understand them ( goals, displayed data, filters…) and eventually use them.
As soon as you import this information into DataGalaxy, it becomes available to all users. This avoids the proliferation of identical reports and allows you to set up a real BI Governance.
Each object in DataGalaxy has a life cycle status and a property. A good way to find out if you can use it and whom to contact for more information!
Ease the expert works
————————
You have set up datamarts and datasets to enable the creation of new reports and algorithms? well done !
The next step is to share this information with your experts so that they could work faster and avoid data crossing discrepancies ? DataGalaxy helps you to spread data knowledge to your users.
You can benefit from different graphic representation to understand the links between objects :
- Diagrams to represents the links between tables in a relational database,
- Lignage to understand the dataflows
- Exploration to represent all the links between objects including functionals one
Your data scientists can also create a personal diagram to analyse the transformation they want to implement and document their hypothesis. They want to go further? they can use versioning to create a new version of the mapping and better understand the impacts of multi-objects!


Doubts remains on the role of a column or a field?
Use the toggle to switch from a technical view to a functional one and confirm the meaning of the object you want to use.
Discover The Data Knowledge Catalog

The Data Knowledge Catalog
Easy access to you and your teams' entire data knowledge

Processing Catalog
Control on how your data assets are transformed and used as an organizational asset

Business Glossary
Bridge the gap between business, IT, and technical teams
Data Lineage
In-depth visual analytics tracking, research, and visualization

DataGalaxy Connectors
Our library of 70+ ready-to-go connectors to effortlessly identify and map your organizational data, processings, and usages
