
With a passion for turning data complexity into clarity, Jessica Sandifer is an experienced content manager who crafts stories that resonate across technical and business audiences. At DataGalaxy, she creates content and product marketing messages that demystify data governance and make AI-readiness actionable.
Diagramming tools for data catalog success
13 May 2024 │ 5 mins read │ Data Governance by Jessica Sandifer, Tech writer

Navigating a data landscape teeming with diverse data assets is no small feat. As organizations amass larger and increasingly complex datasets, managing and making sense of this information often becomes a daunting task.
Often, traditional data catalog tools lack the intuition offered by visual representations. Discussing the importance of an integrated diagramming tool within a data catalog reveals a crucial oversight, and neglecting this feature can significantly obstruct an organization’s data management and democratization initiatives.
Keep reading to discover the importance of using a data catalog with an integrated data diagram feature for organizational success.
Data diagramming defined
Data diagramming and visualization refers to the ability to trace and visualize the journey of data as it moves through various systems, processes, and transformations within an organization. It offers a complete picture of how data is created, used, and transformed, providing insights into data quality, compliance, and business impact.
In the dynamic world of data, data diagramming emerges as an integral process that outlines the entire data life cycle – It’s a critical tool that enables businesses to undertake system migrations with confidence, implement process changes with minimal risk, track data-related errors, and integrate data discovery with a metadata overview to establish a robust data mapping framework.
Data diagramming can also include creating and exploring interactive representations of business models with ease, an essential need for organizations looking to increase data literacy among the entire team.
Data, data everywhere!
Data catalogs are essential for managing the vast oceans of data collected by modern organizations. However, as these data collections grow, users can find themselves lost amidst a sea of tables, schemas, and metadata.
However, it’s important to note that data objects do not exist in isolation: They are interconnected in intricate ways that define their meaning and utility. Without a visual representation of these relationships, users are left to navigate a labyrinth of metadata: A task both daunting and prone to error.
The challenge, then, is not just about managing data, it’s about understanding and navigating its complexities.
A picture is worth a thousand words
The power of data visualization cannot be overstated. It taps into the human brain’s innate ability to process and remember visual information more efficiently than textual data. Diagramming tools in data catalogs translate the abstract relationships between data objects into clear, visual formats.
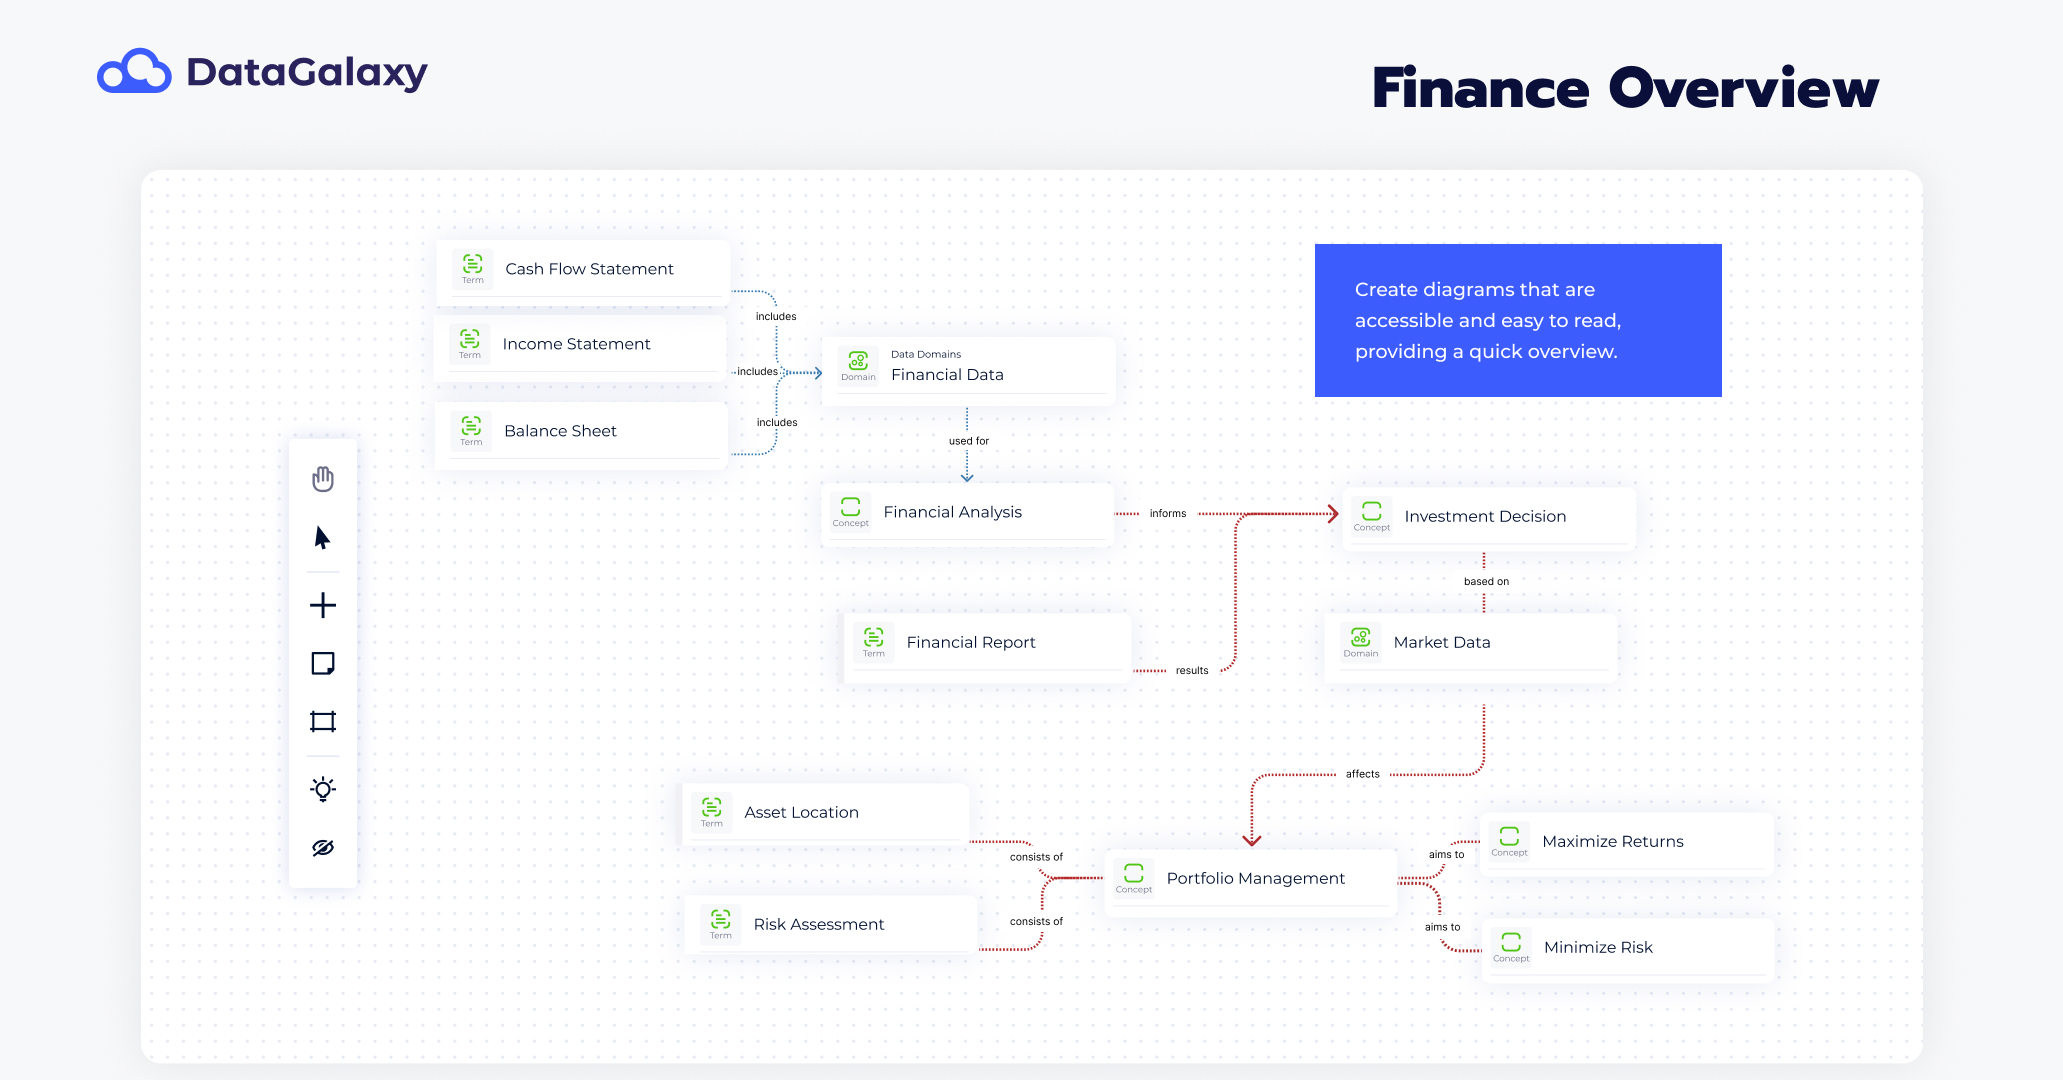
By offering examples such as entity-relationship diagrams, lineage visuals, and impact analyses, we demonstrate the undeniable value of seeing, rather than reading, data connections.
All data catalogs can give users a list of assets, but DataGalaxy provides both a list of assets to easily find information about objects and a diagram tool, giving users the opportunity for global understanding. DataGalaxy’s Data Knowledge Studio’s graphical elements, workflows, and diagram tools help expert users create easy-to-understand models based on information stored in their data catalogs.
Together, these tools simplify data visualization and knowledge sharing so business users can grasp all the information they need at a glance.
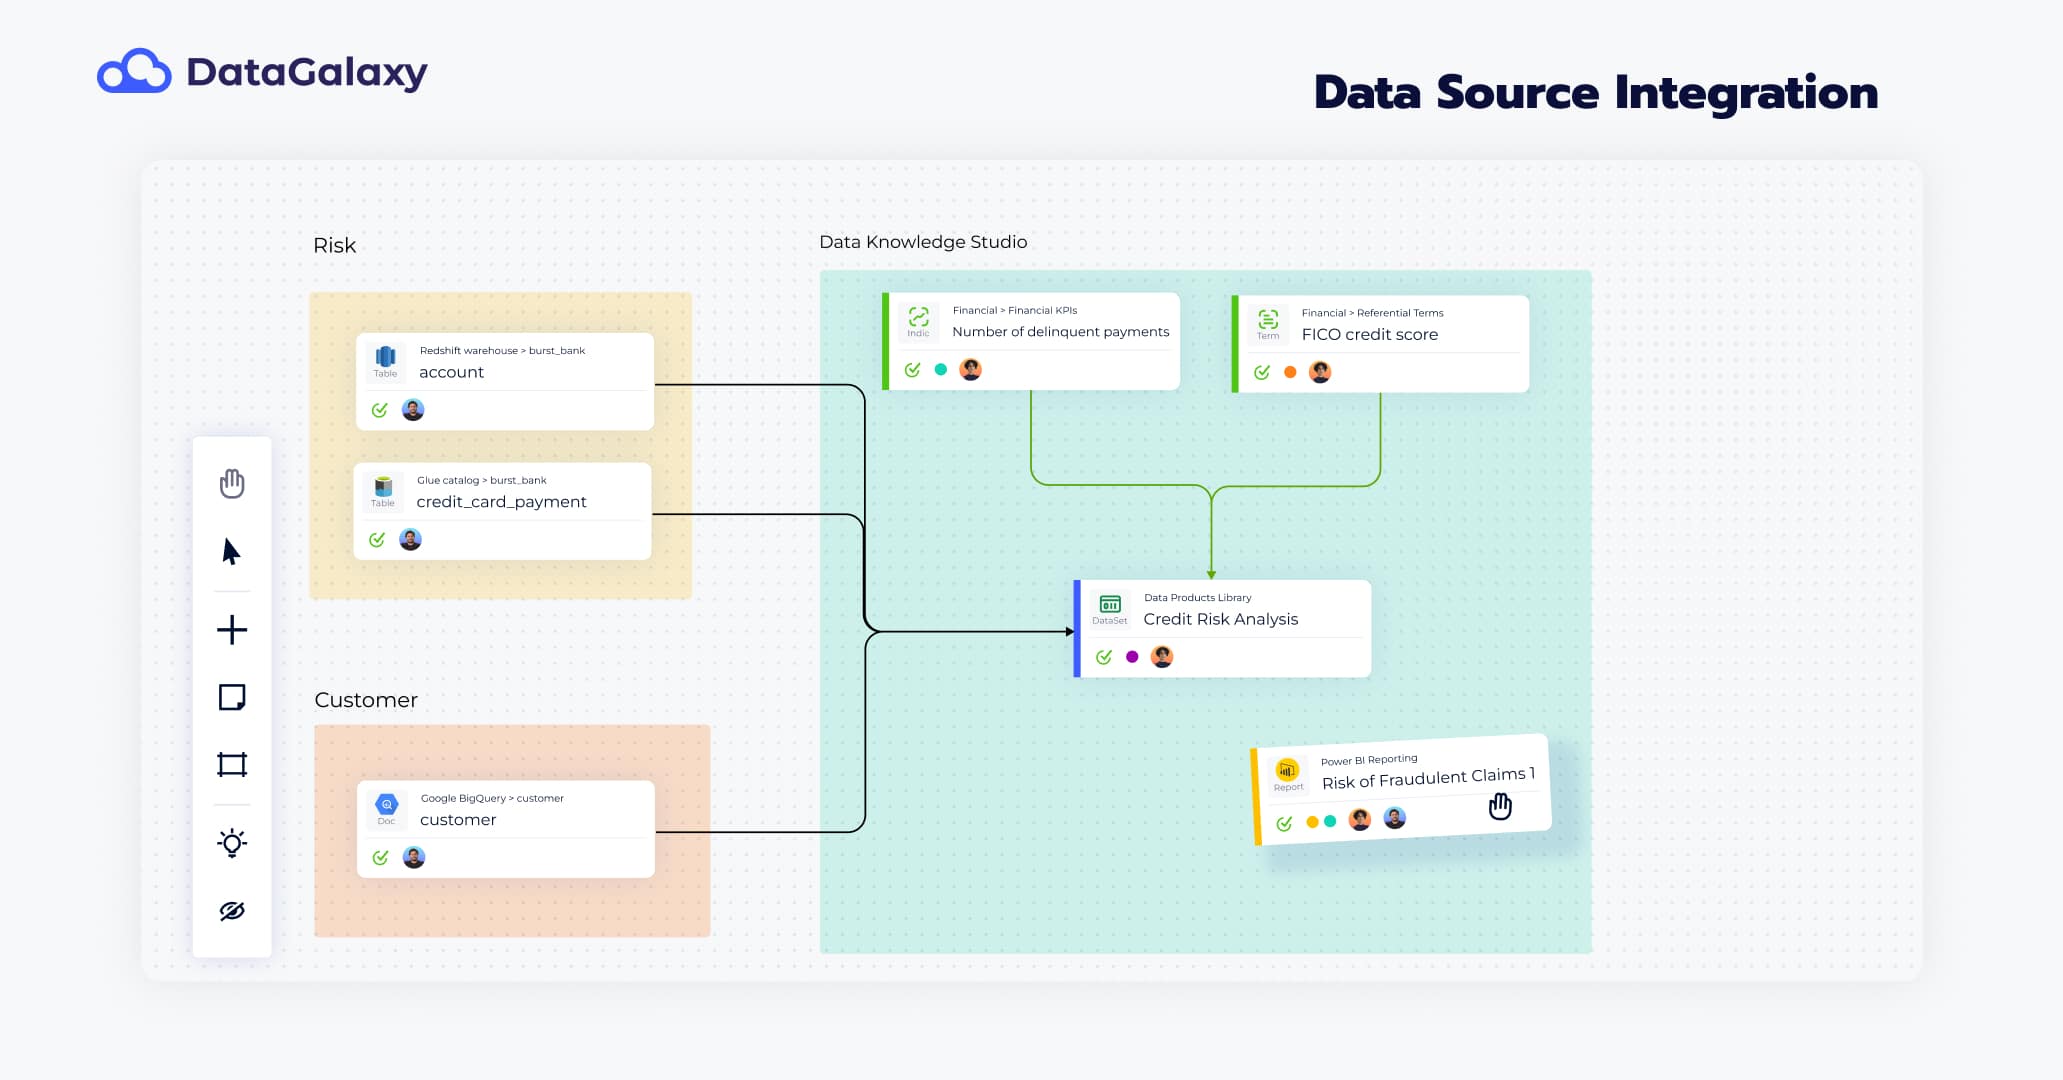
One significant data management hurdle is information fragmentation across multiple platforms and tools. This dispersion not only complicates data discovery but also leads to inconsistencies and inefficiencies.
From source to target, data diagramming outlines the path of your data’s flow, including the data’s entire lifecycle. When data’s movement is depicted, an organization’s business intelligence team will have a much easier time determining exactly how data may have been altered and with whom it interacted.
A data catalog like DataGalaxy with integrated diagramming capabilities offers a solution to this fragmentation. By centralizing knowledge in a single, visually enriched platform, organizations can ensure consistency, improve efficiency, and facilitate a more thorough understanding of their data landscape.
This centralization is not just about convenience; it’s about creating a single source of truth that can be easily accessed and understood by all.
Democratizing data with visual aids
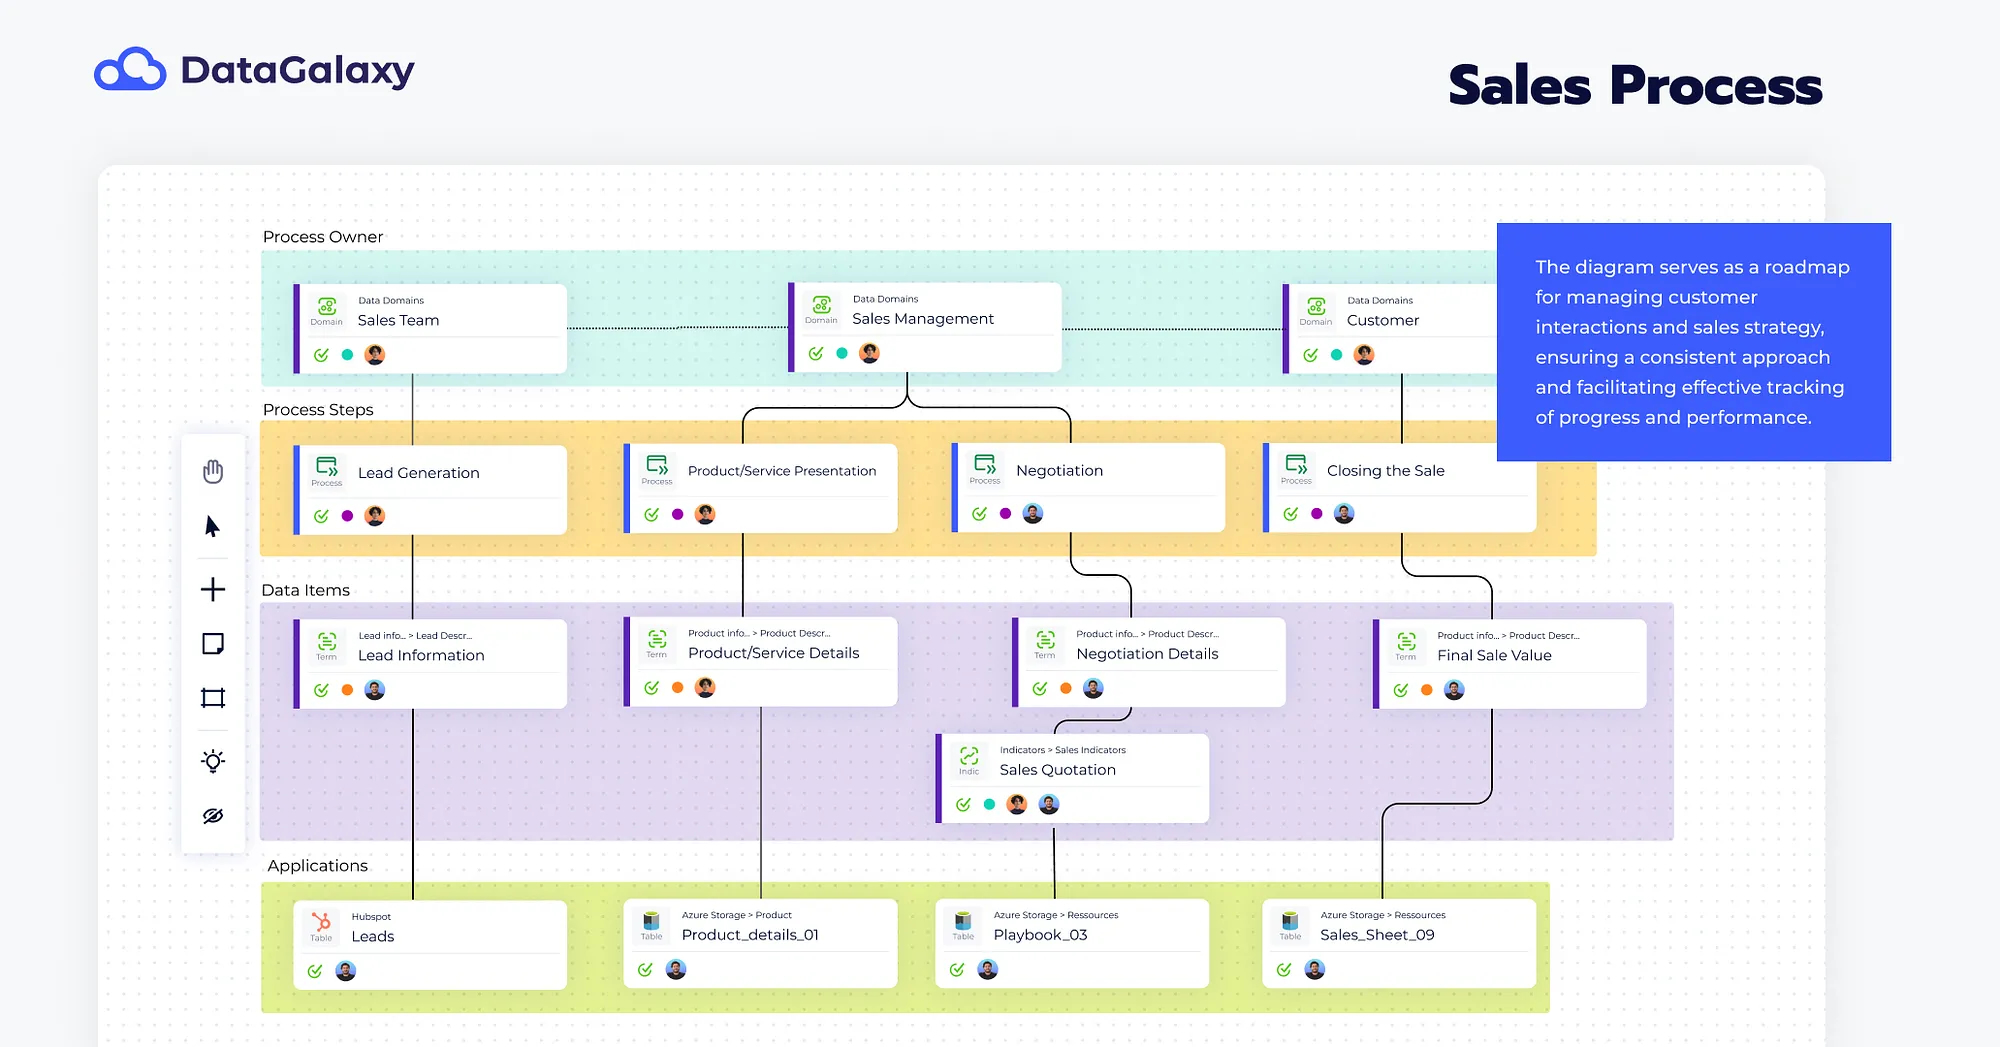
The ultimate aim of any data strategy is democratizing data, or making it accessible and usable for decision-making across all levels of an organization. Diagramming tools play a critical role in this process by breaking down the barriers of technical jargon and complex data relationships, making the data catalog a tool for everyone, not just data professionals.
This inclusivity is vital for fostering a culture of data-driven decision-making, where insights are not siloed within data teams but are shared across departments, empowering all to contribute to the organization’s success.
With DataGalaxy’s Data Knowledge Studio, users can have a clear understanding of their data’s processes, thereby helping business users have a global view of their assets and their interconnections.
DataGalaxy for data diagramming success
At DataGalaxy, The Data Knowledge Studio helps our users make sense of the data they work with every day. It provides visual representations of complex information, making it easy to quickly understand and analyze for everyone on the team.
Whether you’re a Data Scientist, Business Analyst, Chief Data Officer, or data user, DataGalaxy’s Data Knowledge Studio is an invaluable tool that will help you make better, more informed decisions to benefit the entire organization.
Conclusion
The absence of diagramming tools in your data catalog is not a minor oversight; it’s a critical flaw that can undermine the effectiveness of data management strategies.
Effectively employing data diagramming best practices is integral to optimizing data management processes and enhancing overall business performance.
From the data lake and warehouse access lineage that boosts data security and query history lineage that improves data interaction to data processing lineage and data ingestion lineage that ensures data integrity and quality – each practice plays a crucial role in the data lifecycle.
Understanding and implementing these practices not only helps troubleshoot and mitigate issues but also turns data into a strategic asset that drives organizational decision-making and growth.
Related posts
Implementing effective data governance in 8 easy steps
Today, organizations recognize the critical role of data governance in managing and leveraging their data effectively. Implementing data governance is essential to ensure data quality, regulatory compliance, and data-driven decision-making. By establishing a solid data governance framework, organizations can unlock the full potential of their data assets and drive business success. This article outlines eight crucial steps to […]
Data governance in 2026: Benefits, business alignment, and essential need
In a world where data has become more vital than ever, understanding how to effectively manage and utilize this resource is essential. One approach that continues to gain attention is data governance. The benefits of data governance can impact an organization at multiple levels by driving better decision-making, improving operational efficiency, and fostering regulatory compliance. TL;DR […]
The top 8 best practices for successful data governance implementation
Data may be the fuel of modern business, but without governance, it can just as easily create chaos as it can create value. Data governance is the framework that ensures every piece of information in your organization is accurate, secure, accessible, and trusted—the invisible operating system that keeps analytics, AI initiatives, and everyday decision-making on […]
Why is data governance important in an AI-first world?
Data governance isn’t new. But in an AI-fueled, risk-heavy, insight-obsessed world, it’s never mattered more. Today, data isn’t just a byproduct of doing business: it is the business. It powers AI models, shapes customer experiences, drives strategy, and fuels growth. But without a dynamic data governance program? Good luck. Inconsistent formats. Unknown sources. Conflicting definitions. […]
2025’s top 10 data governance best practices for modern data teams
The pressure on your data teams has never been greater. Data volumes are multiplying. AI tools and platforms are proliferating. Every decision, insight, and risk now traces back to one critical question: Can we trust our data? As the backbone of reliable, scalable, and AI-ready operations, data governance’s moment has arrived once again. With this in […]
Data governance & observability: 3 steps to combined value
Data governance and data observability are interdependent. While governance establishes the rules and standards for data management, data observability ensures those rules are being followed in real-time. Together, they create a feedback loop that reinforces data trust and AI readiness. This article will discuss the basics of data governance and observability, discuss the best options to […]