Data governance used to be about one thing: Control.
Control over who could access data. Control over how it was stored and protected. Control over compliance and risk.
However, executives today are less inclined to hear about new policies, audits, or approval workflows. They want to see results. They want to know: What are we getting out of governance?
Not in technical wins, but in tangible outcomes.
That kind of shift demands a different sort of measurement. One that captures the results leadership expects. Meeting this elevated expectation starts with using the right KPIs.
Here are the top three metrics that reveal how your governance program delivers real enterprise value, and how to put them to work.
What is value governance?
Value governance represents a strategic shift in focus from managing data to realizing enterprise value from it.
Security, privacy, and compliance remain core elements of data governance. But they don’t speak to impact. Where an organization sits on the data maturity model spectrum determines how ready it is to move beyond control and toward value, making that assessment a natural starting point for any value governance initiative.
Value governance aligns data governance practices with business goals, connecting every initiative — from new dashboards to quality controls — to outcomes that leadership actually cares about: Growth, savings, and risk reduction.
It’s not about more rules. It’s about better results.
The 3 KPIs for driving real data governance value
KPIs only matter if you track them. Move from governance in theory to governance that delivers.
The only way to prove governance delivers actual value is to measure it with KPIs that denote its contributions to critical business processes and outcomes.
The following are three metrics that do just that.
KPI #1: Value realization rate
Launching a project is easy. Delivering real, verifiable impact? That’s harder.
Value realization rate measures how many of your data initiatives move the needle. Whether that’s helping sales increase conversion rates, streamlining operations to cut costs, or tightening compliance to reduce audit risks, VRR tells you if your investments are paying off, not just keeping busy.
Definition
The percentage of data projects that deliver measurable business outcomes
Why it matters
Without this KPI, you’re flying blind. High realization rates mean your data team is not just busy; it is driving outcomes leadership can see and value.
Tracking value realization rate keeps governance focused where it should be: delivering results.
KPI #2: Time-to-value
Great results don’t mean much if they show up too late.
Time to value tracks how quickly your data initiatives deliver outcomes once launched.
Definition
The time it takes from project initiation to measurable business impact
Why it matters
Business cycles change fast. Long lead times drag down momentum, waste resources, and co-opt trust.
A fast time-to-value proves your data strategy can move with speed and deliver maximum impact.
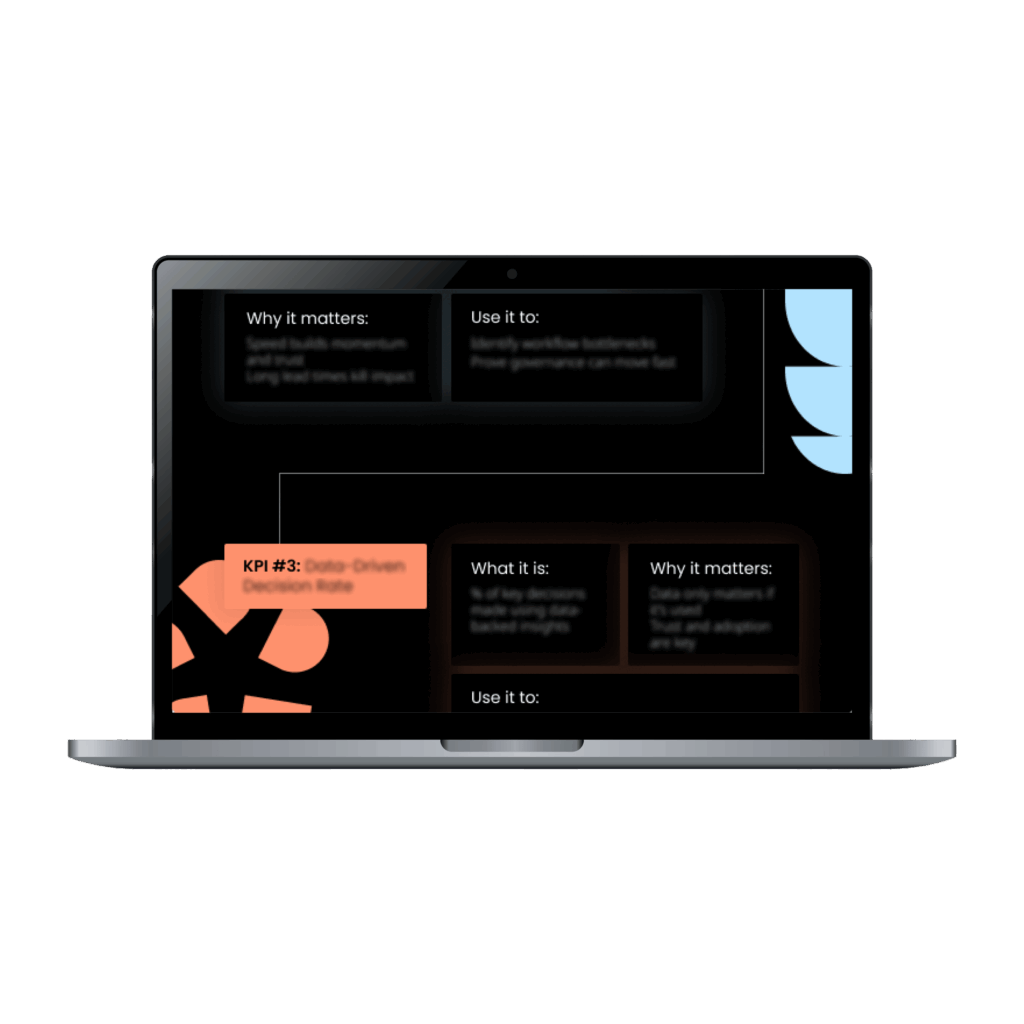
KPI #3: Data-driven decision rate
Having data isn’t the goal. Using it is.
This KPI tracks how often critical business decisions are grounded in real, verifiable insights. It shows whether data is woven into business operations or just sitting on the sidelines.
Definition
The percentage of strategic decisions made with data-backed insights
Why it matters
A strategy based on gut instincts is risky. When strong data supports decisions, companies move with greater confidence and less uncertainty.
A high data-driven decision rate indicates that data isn’t only available but also trusted and embedded in decision-making processes.
That’s what turns data governance into a true value driver.
How do I build a value governance dashboard?
Tracking KPIs in isolation won’t get you far. What’s needed is a dashboard that pulls them all together to make them visible and ties them directly to realized business outcomes.
A value governance dashboard does precisely that. It doesn’t just parade a bunch of numbers across a screen. It tells the story behind the numbers.
Are projects delivering value? How quickly? Are key decisions truly data-driven?
What a strong value governance dashboard should include:

Clear KPI definitions so there’s no ambiguity about what’s actively being measured

Real-time tracking to spot trends early and adjust course when needed

Visualizations that make patterns & gaps obvious at a glance
Drill-down capabilities to explore specific projects or domains
When designed using these elements, your dashboard becomes a strategic asset that helps teams prioritize, course-correct, and accelerate value delivery.
A dashboard is the front end. However, without the right tools in place, those KPIs won’t track themselves.
The right tools to track KPIs
You can’t improve what you can’t see. The right tools bring visibility and context to governance efforts beyond raw numbers.
Value governance KPIs depend on systems that connect governance work directly to outcomes leadership can measure and value.
Here’s what to look for:
Automated data collection
Manual inputs invite lag and errors. Automated pipelines keep KPIs current, eliminating the need to chase after stale spreadsheets.
Real-time dashboards
Static reports are snapshots. Live dashboards let you see trends and risks while there’s still time to act. Combining data governance and observability takes this further, monitoring data freshness, completeness, and accuracy in real-time ensures your KPIs reflect what’s actually happening in your pipelines, not what was true last quarter.

Spot issues before they spread
Track, assess, and act on data quality directly inside DataGalaxy’s quality monitoring. Define what “good” looks like, assign responsibilities, and monitor issues in context, where governance already happens.
Flexible integration
Your tools should pull from all the systems that matter most: CRM, ERP, and data warehouses. Don’t fly blind with siloed fragments.
Lineage & traceability
Knowing where your data comes from is just the start. Clear lineage shows how it transforms and what decisions it drives.
These features don’t just track activity. They connect data governance to real, provable business outcomes. And with the right tools, they become a compass for value creation.
DataGalaxy is built for value governance
Most platforms stop at data visibility. DataGalaxy goes further.
It connects your data assets, business context, and usage in one place with the tools to track, measure, and prove the concrete value your governance program delivers.
Here’s what’s inside:
Automated lineage & impact analysis
See precisely where your data comes from, where it moves, and what it powers.
When decisions are made, you can trace them back to the data that influenced them.
Real-time collaboration
DataGalaxy connects teams to a live, shared map of your data assets, definitions, and usage patterns.
This mapping brings total alignment from strategy to execution.
Business context built in
Beyond metadata, DataGalaxy ties business terms and goals directly to your data, making it easy to measure business impact, not just system activity.
Customizable dashboards
Track the value realization KPIs that matter most, including time to value and data-driven decision rates, all in one place and tailored to your governance goals.
When governance focuses on outcomes instead of overhead, DataGalaxy helps you prove and improve the value of your program.
The right tools make tracking easy. But real impact comes when KPIs are connected with business priorities from the start.
Aligning KPIs to business goals
Metrics are only as powerful as the goals they serve. Value governance KPIs should be tied directly to what the business is trying to achieve, and to the people accountable for them. Clarifying data owner and steward roles early ensures each KPI has a named owner who can act on it, not just report it.
That means:
- Mapping projects to strategic outcomes: Every data initiative should link back to a business priority. This can include improving customer retention, reducing operational costs, or accelerating time-to-market.
- Defining success in business terms: Forget technical milestones. Define success by the metrics leadership actually cares about: growth, savings, and risk reduction.
Designing data & AI products that deliver business value
To truly derive value from AI, it’s not enough to just have the technology.
Data professionals today also need a clear strategy, reasonable rules for managing data, and a focus on building useful data products.

- Adapting KPIs as goals evolve: Business objectives and strategies change. Your KPIs should change with them. Keep your value governance metrics aligned with what the enterprise is moving toward now, not what was important six months ago.
Aligning KPIs to business goals measures the value your data initiatives bring to the table. Using the right metrics, tools, and storytelling can make that value impossible to ignore.
Proving the value of data governance
You can’t theorize your way to value anymore.
You must prove that your data governance initiatives deliver real business impact above and beyond compliance and control.
Tracking value governance KPIs, including value realization rate, time-to-value, and data-driven decision rates, shines a light on the impact hiding beneath the surface.
It makes your governance program visible, credible, and most importantly, valuable where it counts: in business outcomes that leadership can measure and trust.
FAQ
-
What is data governance?
-
Data governance ensures data is accurate, secure, and responsibly used by defining rules, roles, and processes. It includes setting policies, assigning ownership, and establishing standards for managing data throughout its lifecycle.
-
How do I implement data governance?
-
To implement data governance, start by defining clear goals and scope. Assign roles like data owners and stewards, and create policies for access, privacy, and quality. Use tools like data catalogs and metadata platforms to automate enforcement, track lineage, and ensure visibility and control across your data assets.
-
How do I start a data governance program?
-
To launch a data governance program, identify key stakeholders, set clear goals, and define ownership and policies. Align business and IT to ensure data quality, compliance, and value. Research best practices and frameworks to build a strong, effective governance structure.
-
What is data lineage?
-
Data lineage traces data’s journey—its origin, movement, and transformations—across systems. It helps track errors, ensure accuracy, and support compliance by providing transparency. This boosts trust, speeds up troubleshooting, and strengthens governance.
-
What is data intelligence?
-
Data intelligence transforms raw data into meaningful insights by analyzing how it flows and where it adds value. It uncovers patterns and connections, helping teams make confident, strategic decisions that drive real business outcomes.
At a glance
- Governance must shift from enforcing control to proving business impact.
- Align governance efforts with outcomes leadership actually values — growth, savings, and risk reduction.
- Track value realization, time-to-value, and data-driven decisions to measure governance success.