Restore context and understanding in complex data landscapes
Visual Knowledge Studio lets you model and visualize your data ecosystem through clear, interactive diagrams. Map domains, flows, dependencies, and ownership to turn complexity into shared understanding and align business and data teams at scale.

When one diagram explains more than a whole meeting.
Simplify complex data through visual models
Unite business and technical perspectives
Empower everyone to explore and collaborate
Accelerate understanding and decision-making
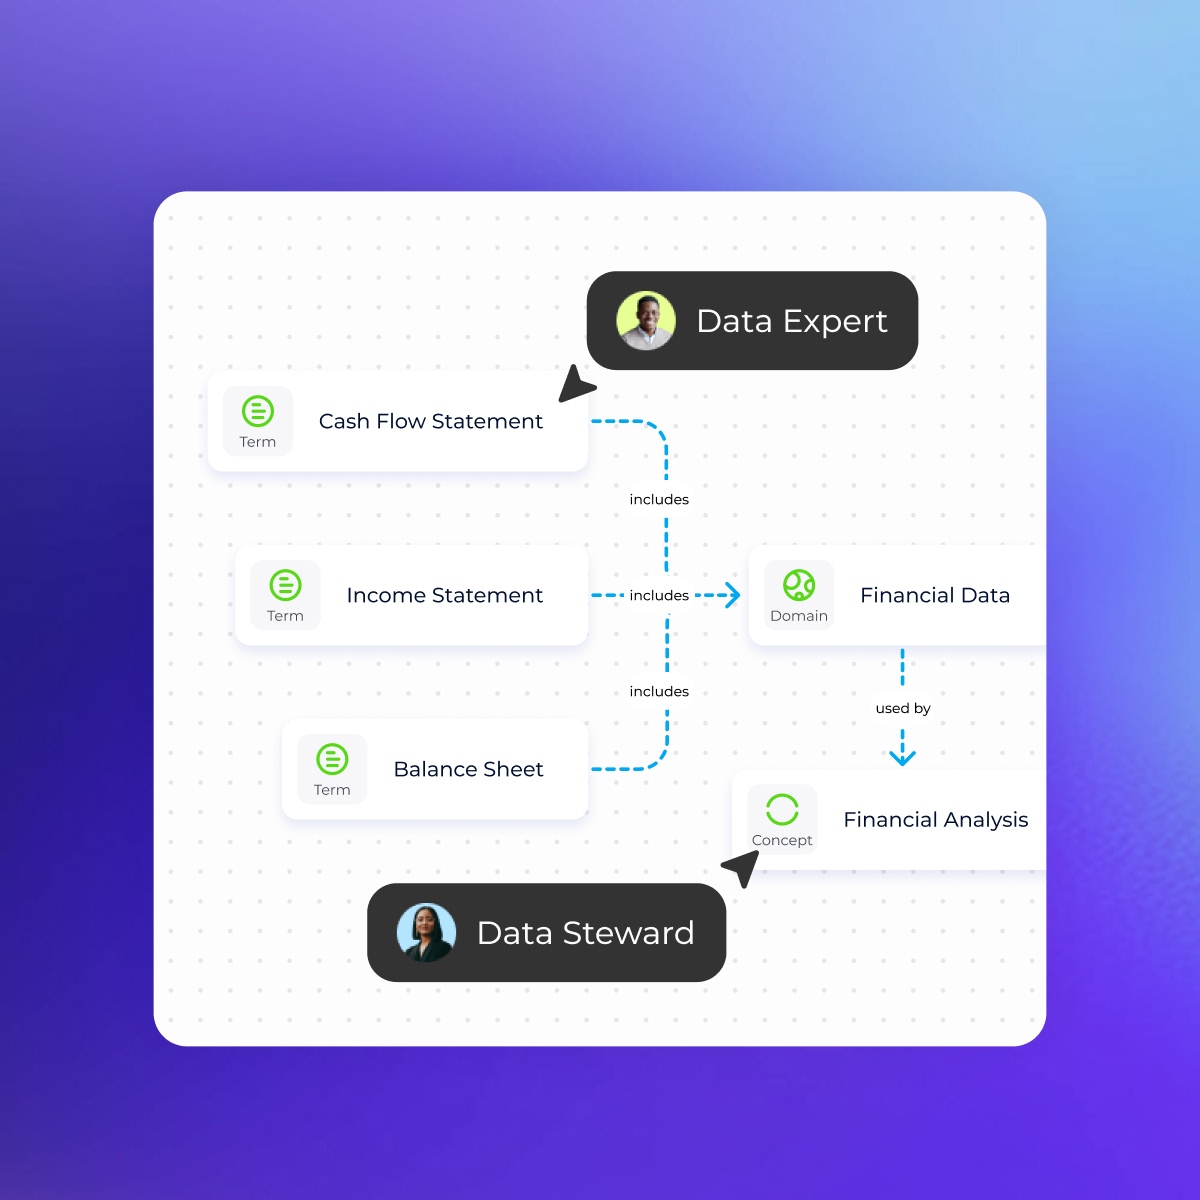
Create visual models from your catalog
Build clear and interactive representations of your organization’s data knowledge. Use drag-and-drop tools to create diagrams from existing glossary terms, datasets, or systems. These visuals bring data context to life, helping teams understand how information connects and supports business processes.
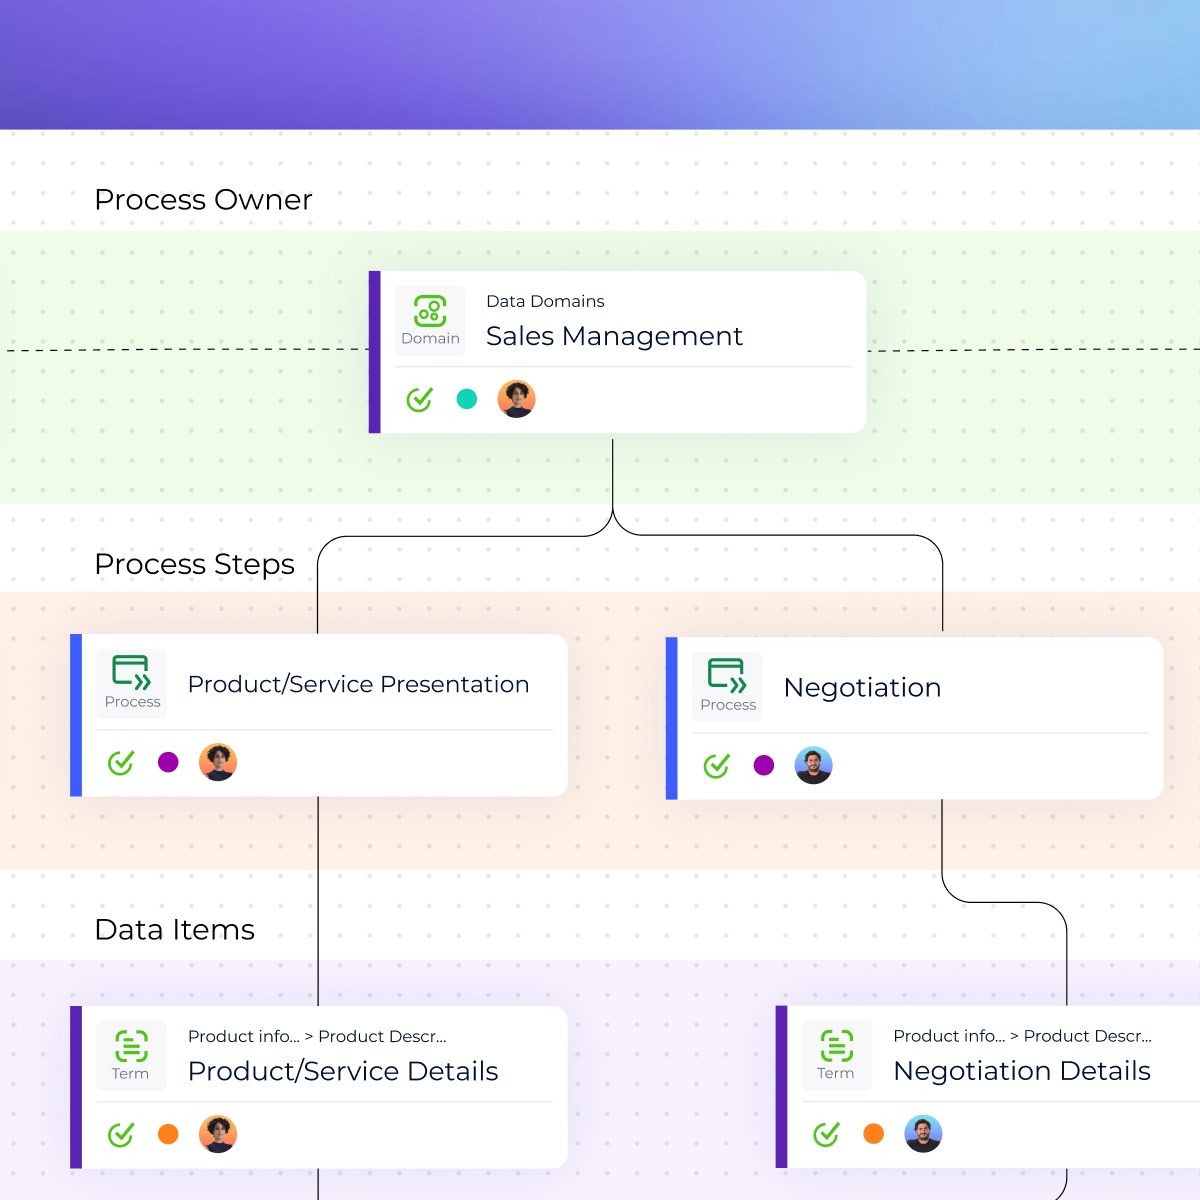
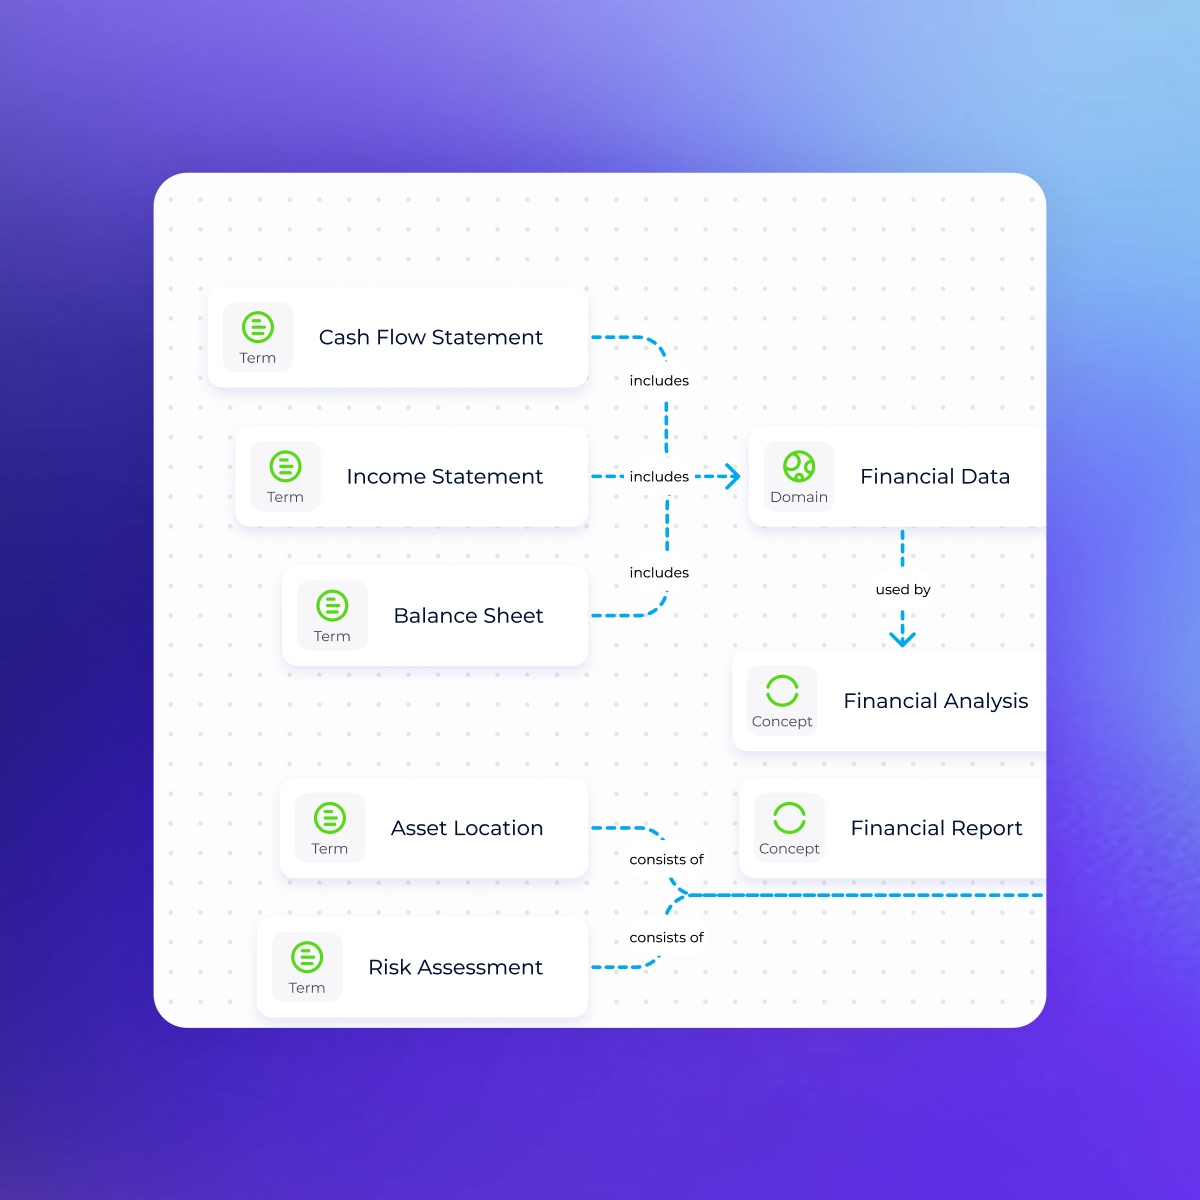
Design business diagrams that tell a story
Transform complex data structures into visual business models anyone can follow. Simply drop glossary assets and link them together to illustrate relationships, dependencies, or processes. These diagrams make it easier for teams to align on concepts and communicate insights clearly.
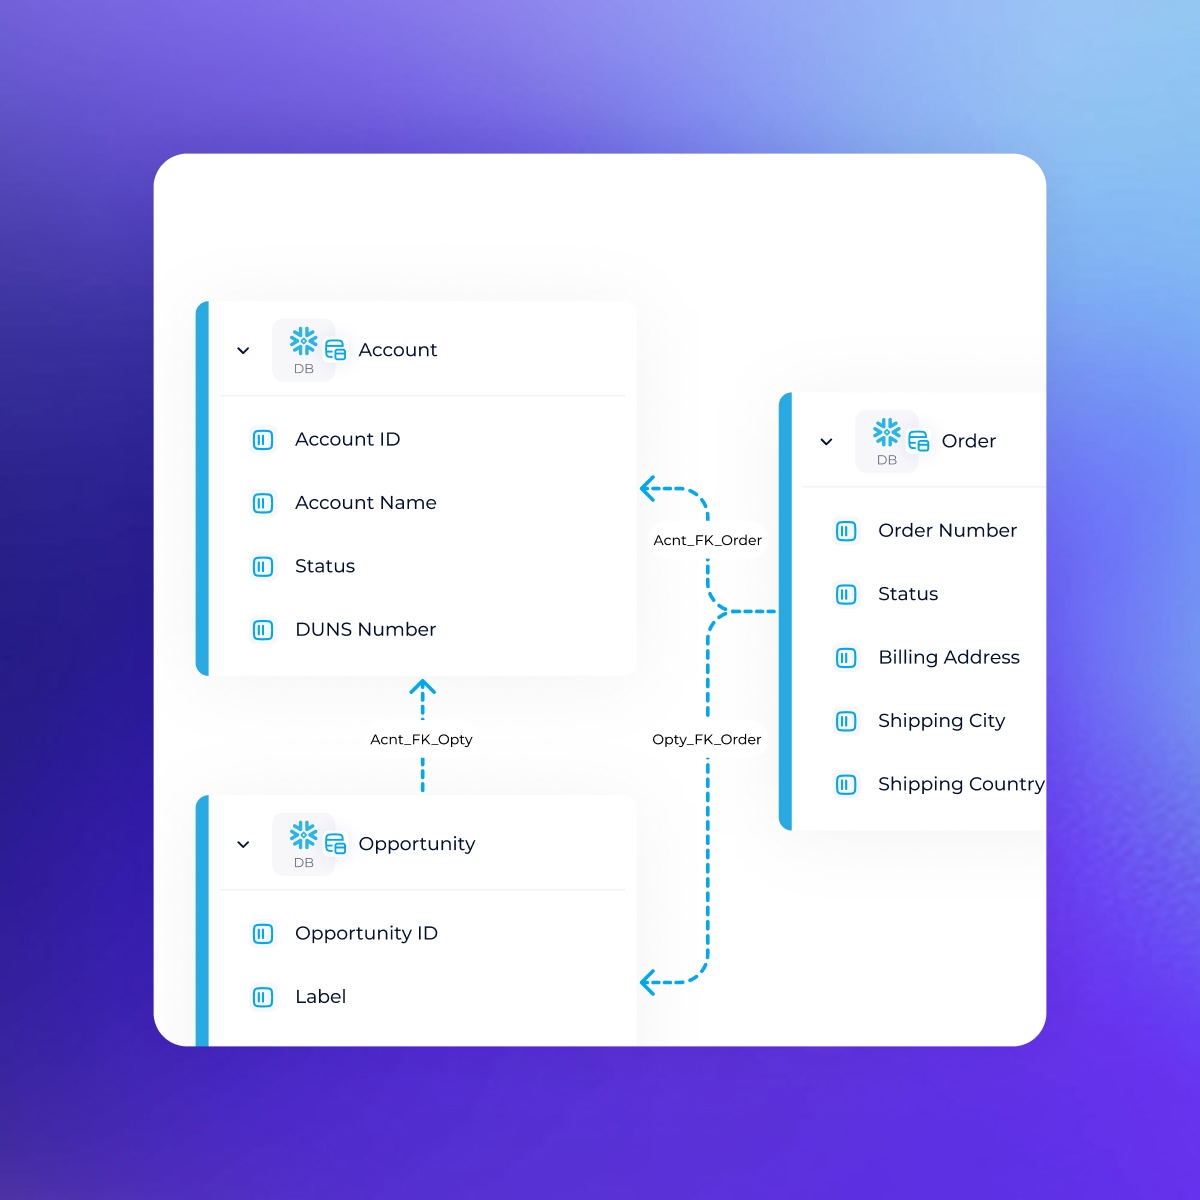
Build and edit technical diagrams effortlessly
For data architects and engineers, the Studio provides intuitive modeling tools. Design physical data models by dragging and dropping tables, defining primary and foreign keys, and formatting columns, all in minutes. This flexibility accelerates documentation, schema visualization, and collaboration between data and technical teams.
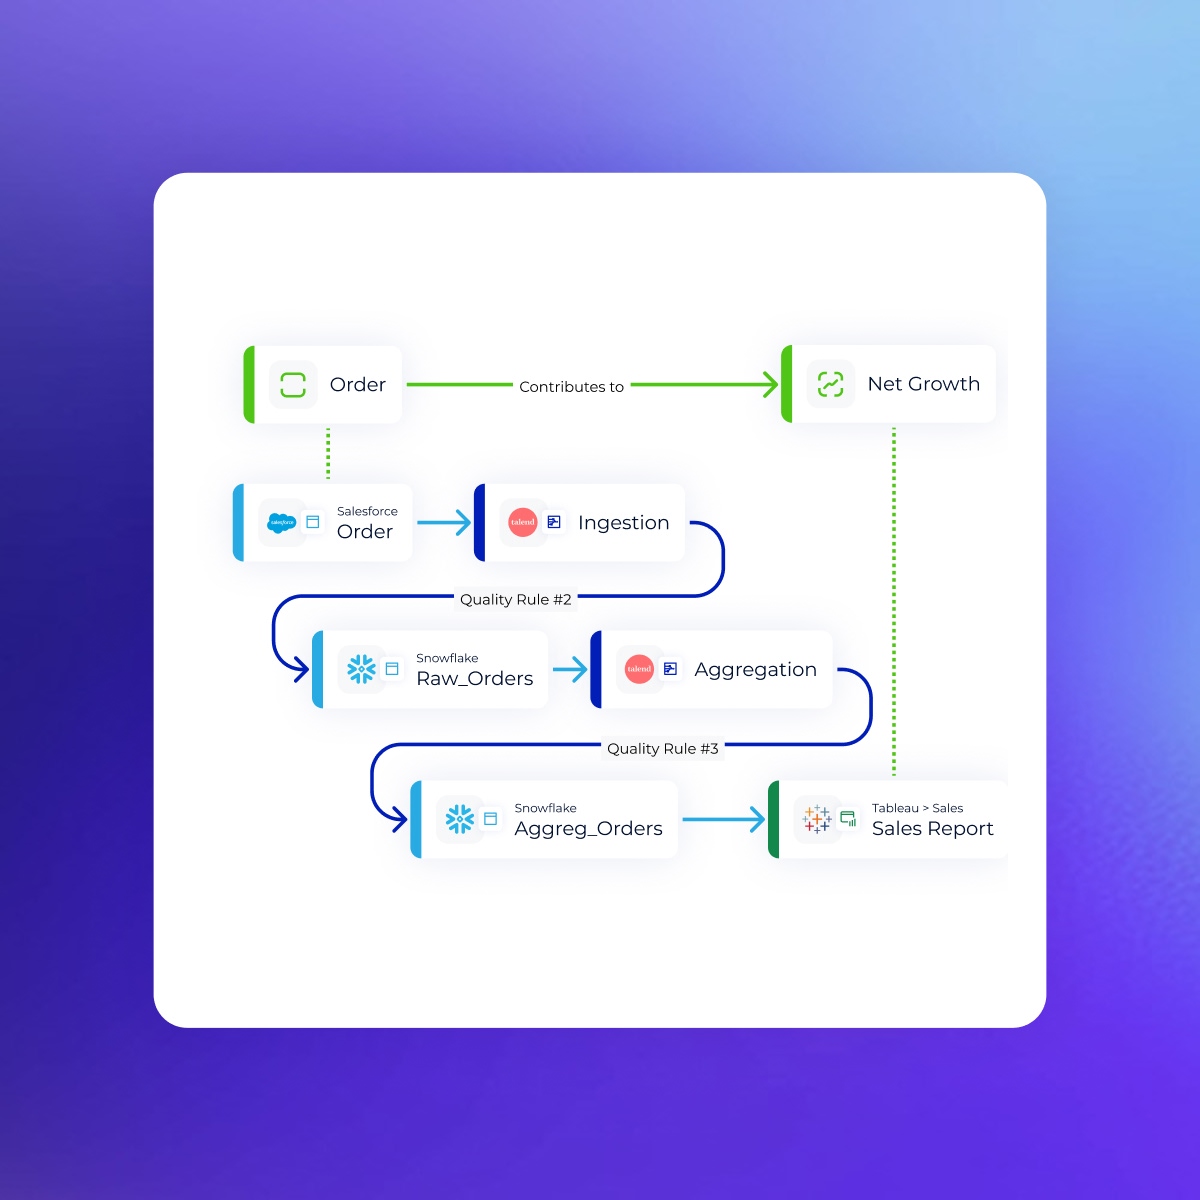
Explore data flows with clarity
Easily visualize how data moves through your ecosystem. Drop a root object and instantly generate upstream and downstream views to understand how assets interact. This helps users grasp dependencies, avoid redundancies, and maintain confidence in data usage.
Collaborate and share knowledge visually
Use interactive diagrams to review, annotate, and present data insights. Teams can comment, adjust, and update visuals together, turning metadata into a shared, evolving source of truth. By making context visible, the Studio builds a stronger data culture and accelerates adoption across domains.
Complex relationships made simple
Start visualizing dataIntegrates with your entire data stack

Request a demo
Questions we hear a lot about the visual knowledge studio
- What is the Visual Knowledge Studio in DataGalaxy?
-
The Visual Knowledge Studio is a diagramming and modeling environment that turns complex metadata into clear, interactive visual models. It helps teams understand how data is structured, connected, and used across the organization.
- Who uses the Visual Knowledge Studio?
-
It’s designed for data stewards, analysts, business users, data architects, and engineers. Whether you’re documenting business concepts or modeling technical schemas, the Studio provides tools adapted to every role.
- How does the Visual Knowledge Studio help simplify complex data?
-
The Studio allows users to create diagrams from glossary terms, datasets, systems, and metadata relationships. Drag and drop tools make it easy to represent processes, dependencies, and data flows in a way that’s intuitive for both business and technical teams.
- How does the Studio support collaboration?
-
Teams can review diagrams together, comment, annotate, and update visual models in real time. This turns metadata into a shared, living resource and strengthens alignment between domains.
- Can I create business diagrams with the Studio?
-
Yes. You can visually map business concepts, KPIs, rules, and processes by linking glossary terms and data assets. These diagrams help teams align on definitions, understand relationships, and communicate ideas clearly.