About the author: Max Faivre
Product Marketing Manager
We’ve all been there. You’re standing by the office coffee machine, debating a data glitch with a colleague, and someone throws out the term data lineage. Suddenly, the conversation descends into a confusing mix of technical jargon and blank stares.
It’s completely understandable. Data lineage has evolved rapidly over the last few years. It is no longer just a niche technical map hidden away in an engineer’s folder; it’s a foundational pillar of a modern data strategy.
If you’re trying to demystify this concept, you’re in the right place. Let’s break down exactly what data lineage is, how it works, and why it is critical for your data ecosystem.
At its most basic level, a broad definition of data lineage is:
“The representation of objects associated with a specific piece of data.”
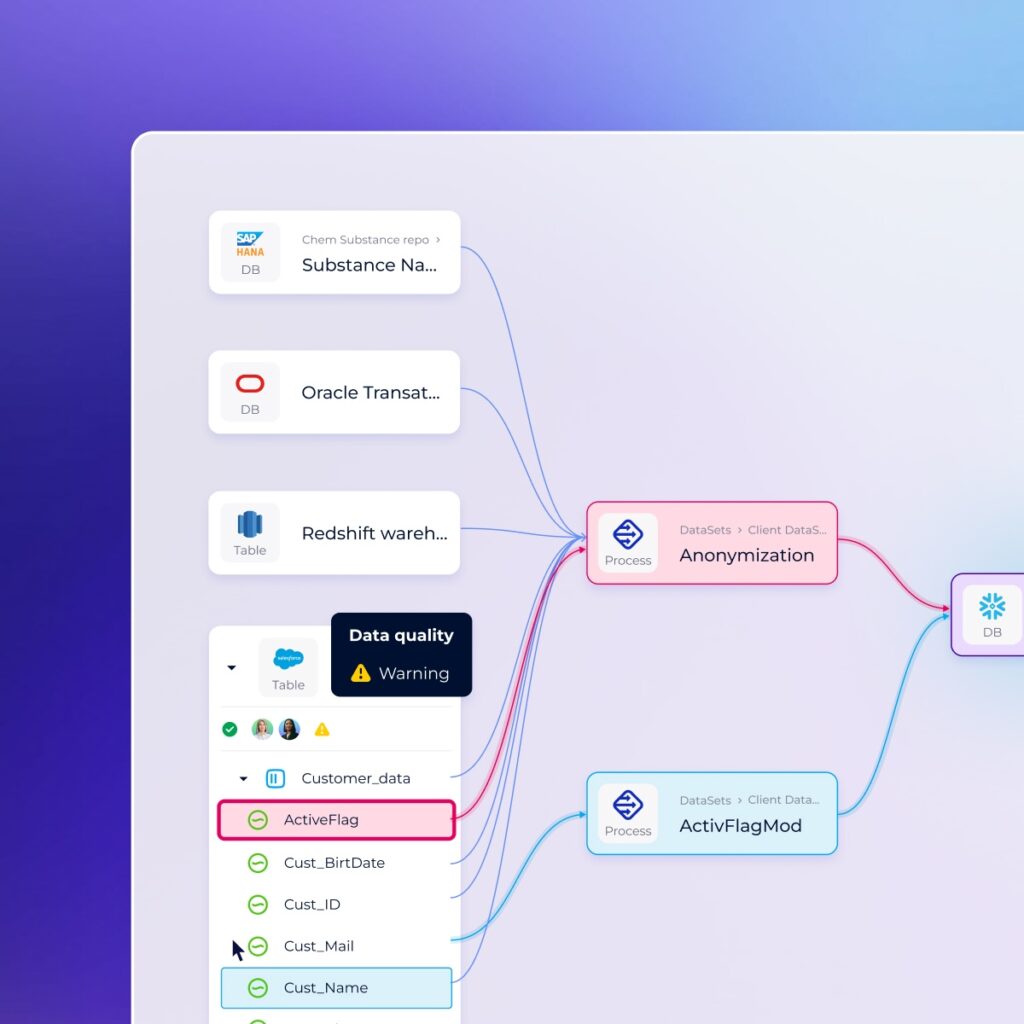
In data governance, data lineage acts as a visual roadmap of a data point’s entire lifecycle. It provides companies with an essential toolkit to trace the origin, transformations, and ultimate destinations of their data using an advanced data lineage tool.
When analyzing data lineage, you need to look at it through two distinct lenses:
Today, tracking this lineage is rarely a standalone feature. It is deeply integrated into broader metadata management solutions and modern Data & AI Product Governance workflows. DataGalaxy showcases how integrating these maps directly into an intuitive Data Catalog product helps cross-functional teams seamlessly build, maintain, and trust high-quality data products.
To truly understand data lineage, you have to look at it from two different perspectives: horizontal (technical) and vertical (conceptual).
Historically, lineage only looked backward to answer a simple question: “Where did this data come from, and what transformations created it?” Conversely, looking forward to see where a data point goes was known as an impact analysis.
Today, these two directions (upstream and downstream) are unified under the terms backward/forward or end-to-end data lineage. Because it tracks the dynamic movement and storage of data across systems over time, it is called horizontal lineage. It maps out the technical journey, alternating between data flows and data storage, which is a core capability of automated data lineage solutions.
With the rise of modern metadata management, a second dimension has emerged. When implementing tailored enterprise data governance solutions, teams rely heavily on vertical lineage to link high-level business concepts down to their underlying logical and physical realities.
Instead of showing a timeline of data movement, it connects different abstraction levels:
CL001 or DIM_CLIENT) inside your data warehouse.This top-to-bottom visibility is also referred to as a data footprint. It allows you to instantly see every physical location where a highly critical business data point lives.
| Feature | Horizontal lineage (Technical) | Vertical lineage (Conceptual) |
| Focus | Data movement, transformations, and lifecycle over time. | Alignment between business concepts and physical infrastructure. |
| Direction | Backward (upstream) & Forward (downstream). | Top-down (from abstract business terms to raw databases). |
| Analogy | A delivery route tracking a package from warehouse to doorstep. | A blueprint showing how a concept on paper becomes a physical brick wall. |
It can be highly tempting to merge both horizontal and vertical lineages into one giant “Global Lineage” view. However, in a standard corporate IT infrastructure, doing this creates an unreadable, chaotic web of thousands of nodes and connections.
The secret to successful data lineage isn’t seeing everything at once—it’s effective filtering.
To get clear answers, you must filter your view by association type and direction based on the specific question you are trying to answer.
Imagine you need to figure out exactly how a specific database column—T_CLIENT.ID_CLIENT—is populated.
By narrowing down your parameters to a single perspective and direction, the clutter disappears, and you instantly see the exact technical source of your data.
While you can technically represent data lineage in text files or massive spreadsheets, humans are visual creatures. Because data lineage deals with objects and their interdependencies, it naturally lends itself to graph databases utilizing nodes (objects) and edges (relationships).
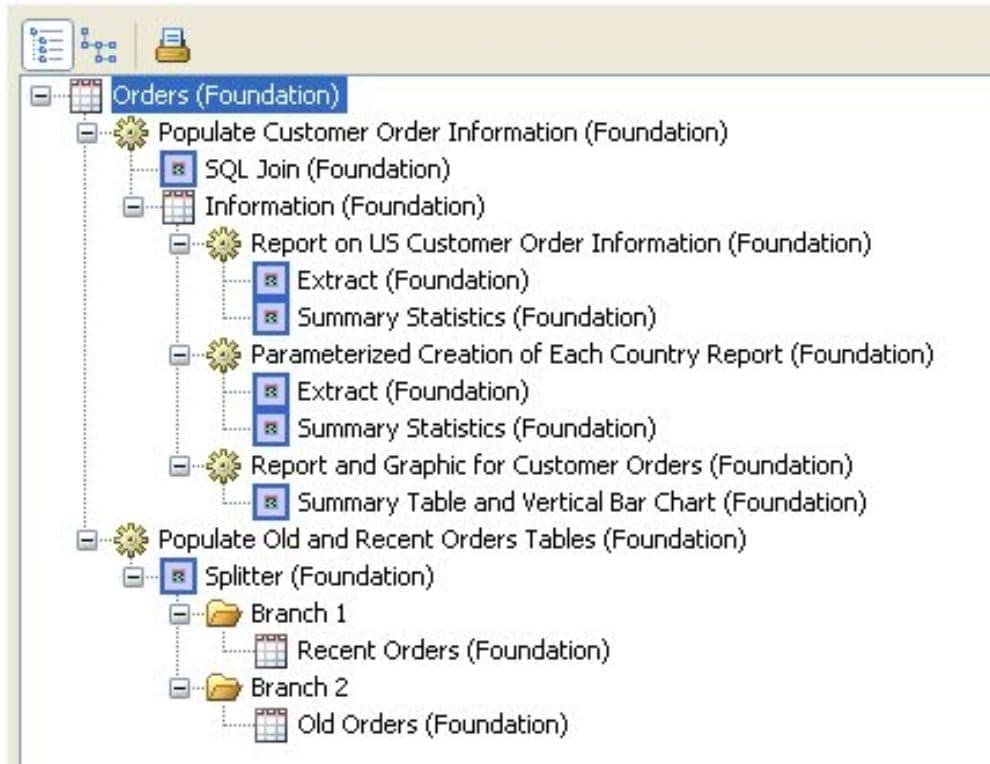
The way we look at these graphs has shifted over time:
Data lineage isn’t just a “nice-to-have” engineering map; it has become a core business necessity for several vital reasons:
As organizations push toward robust data and AI product governance, the market demand for comprehensive data lineage is skyrocketing. Advanced platforms tackle this need by tracking both technical pipelines and business value through specialized software components, such as the DataGalaxy Portfolio product.
However, a word of caution: never trade substance for aesthetics. While sleek, interactive visual graphs are wonderful, your choice of corporate data governance solutions must prioritize functional content management capabilities over mere design. A lineage tool must accurately extract metadata, categorize relationships, and filter out noise. Beautiful design is great, but actionable productivity and shared organizational knowledge are what keep your data running smoothly.
Product Marketing Manager