Metadata to the agents. Value to the people.
The first value governance platform

Trusted by 200+ leaders to turn all their data and AI use cases into measurable business value
Two products. One path to value.
DataGalaxy Catalog and Portfolio work together to close the gap between data knowledge and business impact.

DataGalaxy Catalog
Turn siloed data assets into trusted, actionable context for people and AI to act with confidence.
DataGalaxy Portfolio
Drive alignment, adoption, and prove measurable impact across your data and AI investments.
Together, they form
the Value Governance Platform

Unify all your Data & AI initiatives in a single, living portfolio to connect vision and execution, evaluate priorities, and focus resources on what drives measurable business impact.
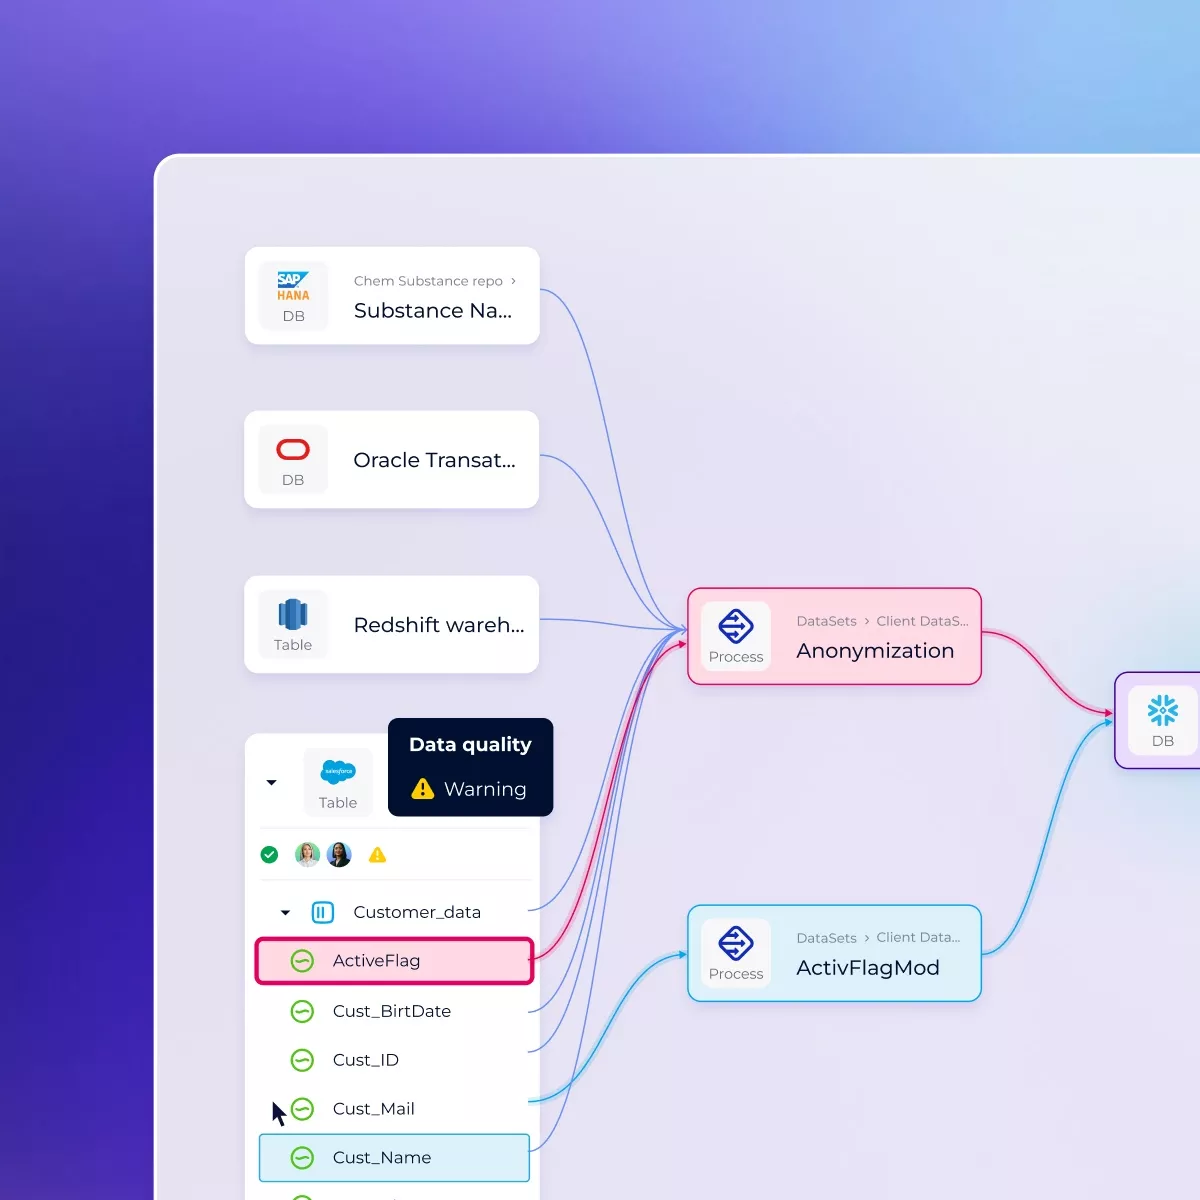
Document and structure data assets collaboratively across teams, combining technical metadata with business context to create a shared, trusted knowledge base.

Apply roles, rules, and policies directly on data assets to ensure quality, compliance, and accountability without slowing teams down.

Expose certified, documented data products in a business-friendly Marketplace so teams can explore, understand, and request what they need, with full governance in place.

Monitor delivery progress, link projects to strategic objectives, and ensure every initiative drives measurable business impact.
Integrates with your entire data stack
Customer stories
“Thanks to DataGalaxy, we can finally track data end-to-end and identify data ownership. DataGalaxy’s Data Catalog has provided so many benefits for our organization, including a fully documented functional and technical use case, a thorough algorithm library, and a clear identification of ownership between IT, business, data, and BI teams.”
The not-so-secret reasons teams love DataGalaxy
End-to-end value governance
The only platform connecting catalog, governance, products, and use cases into one lifecycle, from context to measurable business outcomes.
Built for collaboration
DataGalaxy connects business and technical teams in a shared environment where everyone speaks the same data language and works toward common goals.
Highest user adoption rate
Designed for simplicity and engagement, DataGalaxy helps teams get onboarded fast and keeps them actively involved.
For all teams, not just the data team
From executives to analysts, everyone gets the visibility, context, and insights they need to make better, faster decisions.
Top-rated by Gartner & G2 users
Recognized by leading analysts and loved by users for its ease of use, fast deployment, and tangible impact on data culture.
of governance efforts fail without impact visibility
of CEOs lead data-driven transformation initiatives
of organizations now prioritize cataloging in their data strategies
Secure by Design. Scalable by Nature.
At DataGalaxy, enterprise-grade security isn’t an option—it’s built in. Our Trust Center demonstrates transparent, independently validated practices, exceeding industry expectations without sacrificing usability. When you choose DataGalaxy, you’re choosing confidence at scale.
Verified compliance
SOC 2 certification and accessible audit documentation build trust with your auditors and customers.
Policy-driven governance
Centrally managed policies ensure alignment with GDPR, HIPAA, FISMA, BCBS 239, Solvency II, CPRA, and more.
Built for the enterprise
You get high-end security capabilities with seamless user experience and collaboration.